Tag Archives: osx

Geektool Weather

Geektool is an OSX system preference module that allows you to display information on your desktop. You can display shell, file or image output. I have used this prefpane to display load averages and process data in the past but now I just have it displaying weather info. Its handy for early morning or when a cold spell comes around. Give it a try if you use OSX and think you may have some data you would like to display on your desktop. An Expose Desktop corner and Geektool work nicely together for on the fly info.
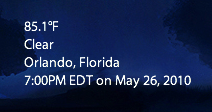
Screen shot 2010-05-26 at 7.01.08 PM

And the code. You’ll need lynx to make this work. Replace 32828 with your zip code. Leave me a comment with your geektool scripts if you give it a try.

lynx -dump 'http://m.wund.com/cgi-bin/findweather/getForecast?brand=mobile&query=32828' | grep 'Temperature' | cut -c 16-21
lynx -dump 'http://m.wund.com/cgi-bin/findweather/getForecast?brand=mobile&query=32828' | grep -m 1 Conditions | awk '{print $2}'
lynx -dump 'http://m.wund.com/cgi-bin/findweather/getForecast?brand=mobile&query=32828' | grep -m 1 Observed | awk '{print $5 " "$6}'
lynx -dump 'http://m.wund.com/cgi-bin/findweather/getForecast?brand=mobile&query=32828' | grep -m 1 Updated | awk '{print $2 $3" " $4" " $5 " "$6" " $7" " $8 $9}'
Monitoring Resource Usage in OSX

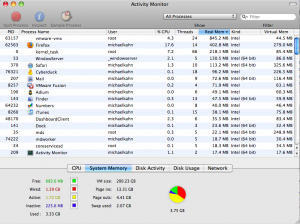
One great pleasure of using osx is that it recovers from high usage and application crashes much nicer then any version of windows could ever imagine doing.  Managing and viewing process status in osx is easy, with Activity Monitor or via terminal with process status (ps).  Also are few widgets for the menubar and dashboard like istat pro that also assist with tracking your usage.

activity monitor Screen shot 2010-01-12 at 10.43.09 PM

A users first option when you notice a lockup or an unresponsive program is to kill it.  This can be done by right clicking on the dock and using force quit or via command line with kill.

So my purpose in writing this post is because I have been maxing out memory usage on my macbook with 4gb in the past few months.  I am working to adjust my usage for a more stable operating system environment until I can make a switch up to a 8gb mbp this year.  To keep a closer eye on my usage I pinned Activity Monitor to my dock and found you can right click on it and change the dock icon to a pie chart of your memory usage in real time.  Do this by right clicking on activity monitor on your dock -> dock icon -> show memory usage.

Screen shot 2010-01-04 at 11.10.23 PM

There are also dock icons for CPU usage, network usage, and disk activity.  This is just one way example of how osx provides a quick easy way to keep a close eye on your usage out of the box.  Pretty awesome.

Followup 5/31/2010
Apple has an article here that explains the different types of mem usage in OSX.
Free (Green):  RAM not being used, that has never been allocated
Wired (Red):   Info in memory that cant be transferred to the hdd
Active (Yellow):  Info currently in memory that has been recently used
Inactive (Blue):   Info in memory not actively being used, but was recently used.  This ‘space’ of your memory is available for use by any application.  It allows for recently ran applications to re-launch faster because it is taking the recently used bits and converting to Active memory.